Understand how users interact with your app — from open frequency and session depth to time spent, bounce rates, and more. Make smarter product decisions with real engagement data.
App Opens per Day
Total Pages Visited
Sessions per User
Bounce Rate
Active Users
Engaged Users
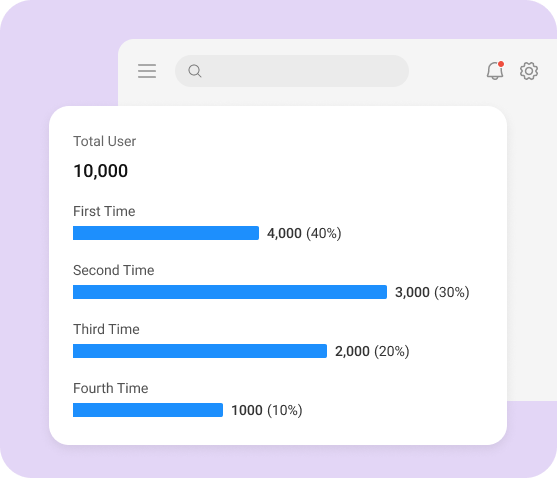
User App Open Frequency
This chart shows how many users opened the app again — a second time, third time, or more — helping you understand long-term interest and app stickiness.
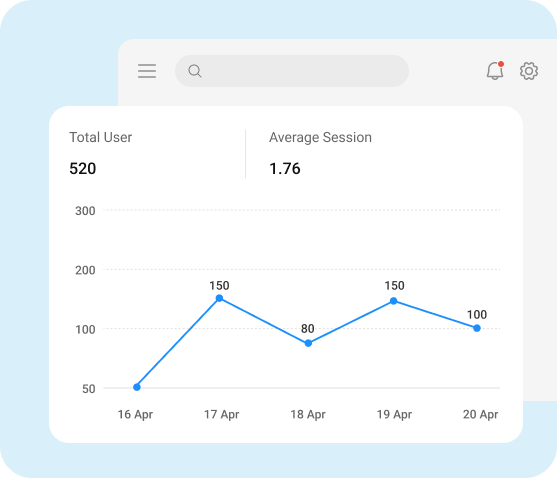
Average Session per user
This metric shows how many sessions (visits) each user starts on average.
A higher number means users are coming back more often.
A lower number could mean users are less engaged or not finding value.
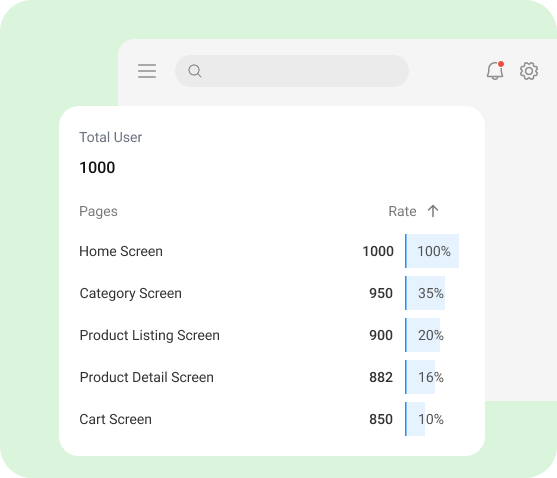
Bounce Rate by Screen
Quickly identify which screens are causing user drop-offs. A 100% bounce on the Home Screen shows no further engagement - while screens like Checkout retain more users.
Use this data to refine your app flow for better retention.
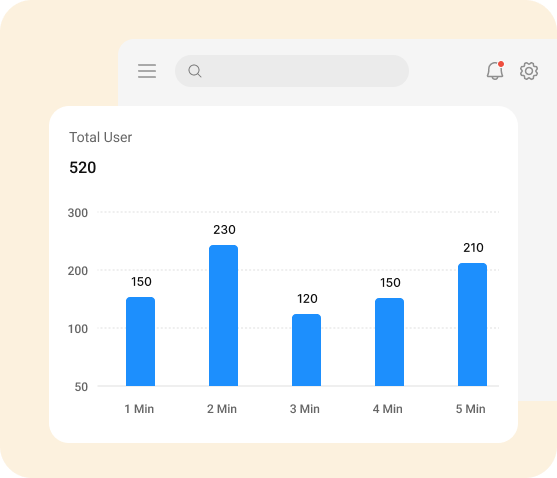
Average Time Spent per User
See how long users stay active in your app. Whether they drop off early or explore deeply, these session lengths help identify how engaging your experience really is.
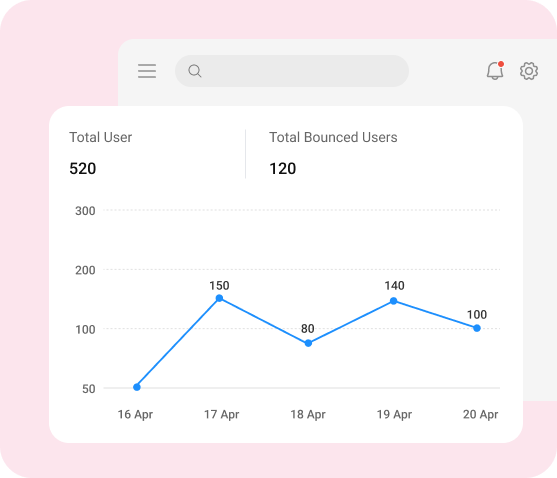
Bounce Rate
See how many users left without further interaction. Spot daily bounce fluctuations and identify problem areas in your user journey.